Center for Problem-Oriented Policing
Step 23: Diagnose your hot spot
When mapping crime, it is helpful to distinguish between acute and chronic hot spots (Step 17). Acute hot spots show abnormal spikes in crime, which may decline naturally, while chronic hot spots have persistently higher crime levels than other areas and are unlikely to decline unless something is done. There are three basic forms of chronic hot spots, each of them linked to particular theories and types of responses.
- Hot dots are locations with high crime levels. These show crime concentrated at facilities or at addresses of repeat victims (see Steps 28 and 29). Multiple crime events at places are represented by dots.
- Hot lines are street segments where crime is concentrated. These might occur, for example, if vehicles parked along particular streets suffer high rates of break-ins. Multiple crimes along street segments are shown with lines.
- Hot areas are neighborhoods where crime is concentrated. Hot areas arise for a variety or reasons. Area characteristics may give rise to crime. Or a hot area may contain many separate and discrete problems. On maps, hot areas are shown as shaded areas, contour lines, or gradients depicting crime levels. Jerry Ratcliffe's hot spot typology (see box) differentiates between two kinds of area hot spots:
- those that have a tightly grouped pattern of events and
- those that have a relatively even spread of events over the hot spot area.
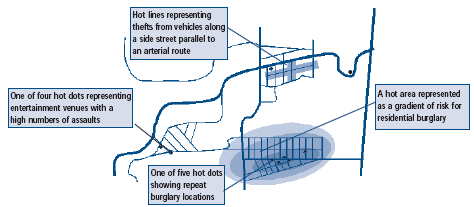
The figure depicts these three forms of hot spots. Troublesome entertainment locations are shown as dots because the assaults are located at addresses. Vehicle break-ins, however, are along continuous street segments, so this concentration is shown as two intersecting lines. Finally, the graduated contours for the residential hot spot suggests that risk for break-ins is highest in one small area but declines as one goes away from the center. The dots within this graduated area depict repeat burglary locations.
Clarifying the nature of your hot spot gives an inkling of response:
- Hot dots suggest changing the physical environment of particular places or changing their management. They also suggest intervening with high-risk victims.
- Hot lines suggest changing streets, paths and other routes, or the environments along them.
- Hot areas suggest large-scale partnerships to change neighborhoods.
The table shows how crime concentration is related to the way it is mapped, and where the response is focused.
Concentration, Mapping and Action
| Concentration | Hot spots shown as: | Action level | Action examples |
|---|---|---|---|
| Places - at specific addresses, corners, or facilities | Dots | Facility, corner, address | Closed circuit television in a parking garage, changing the way alcohol is served in bars. |
| Victims | Dots | Victims' addresses | Helping victims prevent further crimes through target hardening. |
| Streets - along streets or block faces | Lines | Along paths, streets, and highways | Creating cul-de-sacs, changing traffic patterns, altering parking regulations. |
| Area - neighborhoods | Shaded areas | Neighborhoods, regions and other areas | Community partnerships, neighborhood redevelopment. |
Types of Hotspots

Ratcliffe's Hot Spot Typology
Jerry Ratcliffe differentiates among three types of hot spots. He begins with a hot spot area and then examines the point pattern. If all events occur at the same location then the hot spot is a "hot point." Hot points describe the same phenomena as hot dots. If the events are tightly grouped within the overall area, Ratcliffe calls this a "clustered" hot spot. Finally, if the events are spread relatively evenly across the hot spot area, he calls the hot spot "dispersed." Clustered and dispersed hot spots are subcategories of our category of "hot area." Ratcliffe's approach draws attention to the concentration of the events and requires the analyst to define the perimeter of the hot spot area prior to classifying the hot spot.
Source: Ratcliffe, Jerry (2004). "The Hotspot Matrix: A Framework for the Spatio-Temporal Targeting of Crime Reduction". Police Practice and Research 5:5-23.
Analysis of hot spots should begin with places, then move to streets, and finally to areas. Consider, for example, the problem of burned-out cars. Are they repeatedly found at specific addresses? If yes, then you should ask why these places are chosen instead of other nearby sites. If no, you should move on to examine streets. If you find street-level concentration, you should compare streets to find out why some attract burned-out cars and others do not. If there is little street-level concentration (i.e., crime is spread relatively evenly across many streets), then you should consider community concentration and compare high- and low-concentration neighborhoods. This approach assures a highly focused response.
In the figure, the hot burglary dots indicate repeat victims within the overall neighborhood problem. An area hot spot alone would not reveal this. Before proceeding further, you should determine if the area hot spot is largely due to the few repeat burglary spots. You can do this by treating each crime location as if it had only a single event, and then look at the area. If it is no longer hot, then the problem is driven by a few hot places. If the area is still hot, then these repeat burglary dots are fragments of an area concentration of burglaries.
Hot spot analysis can be a valuable tool early in the problem-solving process, but having discovered hot spots, you need to ask why some spots are hot and others are not. Stopping analysis after the discovery of hot spots can result in superficial analysis and the implementation of ineffective responses. If there is no geographical component to the problem, hot spot mapping has little utility and you must use other analytical approaches.
Read More
- Eck, John, Spencer Chainey, and John Cameron (2005). Mapping Crime: Understanding Hot Spots. Washington, DC: U.S. Department of Justice, National Institute of Justice.