Center for Problem-Oriented Policing
Step 51: Be alert to unexpected benefits
You can drastically underestimate the effects of your intervention if you do not take account of diffusion of benefits (Step 13). You may conclude that the intervention is not worth the effort or that it failed to suppress the problem. This is particularly true when diffusion contaminates your control group.
Control groups show what would have happened to problems if you did nothing (Step 47). They need to be as similar to the treatment group as possible, but they must not be influenced by the treatment. If prevention diffuses into the control area, you will get the misleading impression that things would have gotten better if no response had occurred. This invalid conclusion will cause you to underestimate the effectiveness of your program. (See Step 48 for related issues with displacement.)
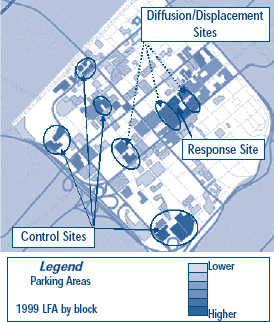
Kate Bowers and Shane Johnson suggest two ways to select control areas when displacement or diffusion of benefits are possible. The first is to create two concentric zones around the treatment area. Prevention may diffuse into the adjacent buffer zone but does not contaminate the outer control area. This is feasible if the control and treatment areas are very similar and diffusion or displacement does not reach the control zone. If these conditions are not met, then option 2 should be used. Here a displacement/diffusion sites near the treatment area are used, but the control areas are widely separated from the treatment and diffusion/displacement areas. Controls are selected specifically for their similarity to and isolation from the treatment area. Multiple control areas can be selected and their crime rates averaged.
The figure shows an example of option 2. Imagine a response to the theft from vehicles in downtown Charlotte parking lots (Step 27). One theft hot spot site is selected for a response. The neighboring hot spots are good diffusion/displacement sites. Earlier analysis showed that a rail line through these lots facilitated the problem, so a third hot spot lot to the south and west on this rail line is also a useful diffusion-displacement site. Control lots are not on the rail line and far enough from the response site that diffusion and displacement are unlikely.
To determine the overall effect of the response on the problem (including any diffusion or displacement effects) you need to answer four questions. Each question has a simple formula. The letters in the formulas follow this pattern.
- R the number or rate of crimes in the response area.
- D is the number or rate of crimes in the displacement/diffusion area.
- C is the number or rate of crimes in the control area.
- The subscripts, a and b, indicate when crime is counted; after or before the response began. For example, Ra is the rate of crimes in the response area before the response was implemented, and Cb is the rate of crimes in the control area after the response was implemented.
Did the problem change from before to after the response? Subtract the crime in the treatment area before the response from the treatment area after the response to get the Gross Effect (GE):
GE = Rb - Ra
A positive number indicates a decline in the problem. Zero indicates no change. And a negative number indicates things got worse.
- Was the response a likely cause of the change? Browers and Johnson suggest looking at the difference in the ratios of the treatment area to the control area before and after; that is divide the before response by the before control minus the after response divided by the after control. This is the Net Effect (NE):

If the net effect is close to zero, the response probably was ineffective, and if NE is negative the response may have made things worse. In either case, displacement and diffusion are irrelevant so you can stop with the answer to this question. But if NE is positive, there is reason to believe the response may have caused the improvement. This raises the possibilities of diffusion and displacement. So you need to answer the next question.
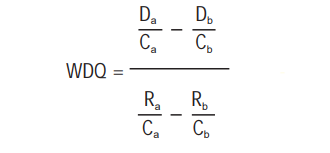
- What is the relative size of the displacement or diffusion? Bowers and Johnson propose the Weighted Displacement Quotient (WDQ) to measure this:

- Da is the crime rate in the diffusion/displacement area after the program and Db is the crime rate in this area before the program. The bottom term (denominator) is a measure of the effectiveness of the response, relative to the control. An effective program will produce a negative number in the denominator. The top term (numerator) shows the relative amount of diffusion or displacement. The numerator is negative when diffusion is present and positive when displacement is present. If it is near zero, neither is present and the WDQ is zero (so you can skip question 4). If the WDQ is positive, there is diffusion (remember, a ratio of two negative numbers is positive), and if it is greater than one, then the diffusion effect is greater than the response effect. If the WDQ is negative, there is displacement. When the WDQ is between zero and negative one, displacement erodes some, but not all, of the response effects. Theoretically, the WDQ could be less than negative one, indicating the response made things worse. However, research suggests that this is an unlikely occurrence.
- What is the Total Net Effect of the response (including diffusion and displacement)? Bowers and Johnson suggest using the following formula to calculate the TNE:

- The first part shows the effect of the response in the response area. The more effective the treatment, the bigger this term. The second part shows the level of diffusion or displacement. It will be positive when there is diffusion and negative when there is displacement. The more positive the TNE, the more effective the response.
Selecting Control and Diffusion/Displacement Sites

Read More
- Bowers, Kate and Shane Johnson (2003). "Measuring the Geographical Displacement and Diffusion of Benefit Effects of Crime Prevention Activity." Journal of Quantitative Criminology 19(3):275-301.