Center for Problem-Oriented Policing
Step 47: Know how to use controls
You should address three questions when assessing a response:
- "What was the implemented response?" A process evaluation answers this question (Step 46).
- "Did the problem decline?" Comparing the level of the problem after the response to the level of the problem before answers this question.
- If the response declined, then ask "Did the response cause this decline, or was it something else?" There are usually many alternative explanations for the decline in the problem.
Answering the third question requires the use of controls. The purpose of controls is to rule out alternative explanations. Different alternative explanations require different types of controls as described below:
Changes in size. If there had been a decline in the number of tenants in an apartment building, we would expect the number of burglaries to decline because there are fewer potential victims. A reduction in targets is an alternative to the explanation that the drop was due to the intervention. To control for changes in size, divide the number of burglaries before and after the response by the number of occupied apartments before and after the response. In the table, what appears to have been a decline in burglaries was partially caused by the drop in occupied units. When this is accounted for, we still notice a response effect. If the time periods before and after are of substantially different lengths, we control for this by dividing again by the number of months before and the number of months after to get burglaries per occupied unit per month.
Using Rates to Control For Changes in Size
| 6 Months Before | 6 Months After | Change | |
|---|---|---|---|
| Burglaries | 41 | 20 | -21 |
| Occupied Units | 83 | 73 | -10 |
| Burglaries/ Occupied Unit | .494 | .286 | -.208 |
Cycles of activity. Human activity oscillates over days, weeks, and months. Some of the most common cycles include commuting and attendance at school, work, and leisure, and seasons and holidays. Such cycles cause regular changes in problems. To control for cycles, compare the same part of the cycle before the response to the same part of the cycle after the response.
Long-term trends in the problem. Problems may be getting worse (or better) before the response (Step 26). Without accounting for trends one could conclude that the response was responsible, when in fact this might have occurred anyway. There are two ways of controlling for trend. The first method is to measure the problem for a long period before the response so that any trend can be identified. Substantial deviations from the existing trend after the response are evidence of a response effect. Anticipatory effects (Step 52) are drops in the problem due to the response, but occurring before the response is fully implemented. These need to be distinguished from longer trends prior to implementation.
The second method is to compare the people or places getting the response to a similar group of people or places not getting the response. This is called a control group or a comparison group. A control group must be similar to the response group with regard to the problem, but cannot receive the response. A control group tells you what would have happened to the response group, if the response group had not received the intervention. If the response group changes differently from the control group, this is evidence of a response effect.
Other unexpected events. Many other things are changing as the response is implemented, one or more of which could have caused the decline in the problem. Instead of an accident-reduction response causing a decline in accidents on a road, for example, slow traffic from the road repairs, going on about the same time as the response, might have been the cause. The standard approach is to use a control group, as we discussed for examining trends. The control area is only useful if it is affected by the same factors as the response area. So, counting accidents on the response and control roads, both of which are influenced by the road repairs, could tell you whether the road repairs contributed to the decline in accidents.
Change in problem measurement. A before-after comparison is only valid if the problem was measured in the same way before and after the response. Measurement differences can cause a perceived change in the problem. Use the same measurement procedures before and after. Before and after observations should occur at the same sites at the same times, watch the same things, and record things in the same way. Before and after photographs and videos should be taken in the same light from the same angles, at the same distance, and with the same size image area. Interviewers should be the same before and after, asking the same questions, in the same order. Examine official records to determine if recording practices are stable over time.
Natural decline from an extreme high. Many problems are addressed because things have become extremely bad. So the response is implemented when the problem is abnormally high. But even a relatively stable problem will fluctuate. A problem that is now abnormally bad will return to its normal level, even if nothing is done (this is called "regression to the mean," and it applies to abnormal lows as well). Comparison area controls may not be useful here, if the response area is at a peak and the control area is not. Instead, examine the long-term fluctuation prior to the response to see if the problem was abnormally bad.
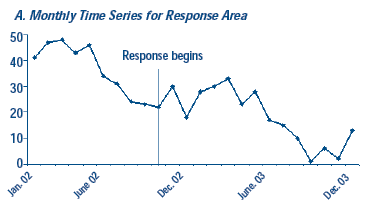
The figure illustrates some of the uses of controls. Moving clockwise around this figure, panel A shows a 24-month time series with a response implemented in early November of the first year. There is a pronounced yearly cycle and a downward trend that are not due to the response. The spike in November following the response suggests that it backfired.
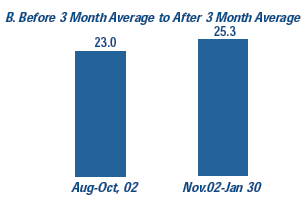
Panel B shows a before-and-after comparison (the average of August-October, 2003 compared to the average of November 2003-January 2004) that suggests a worsening of the problem following the response.
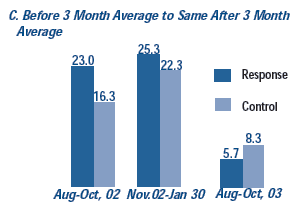
In panel C, a comparison area has been added. The immediate before-and-after comparison shows the response area doing better than its comparison area, but because of cyclical effects we would not have much confidence in these findings. Comparing the 3 months before the response to the same three months a year later accounts for the cyclical behavior of the crime series.
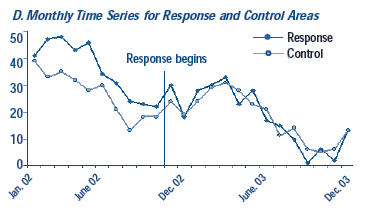
But because some of the decline in both groups maybe due to the general downward trend, panel D provides a better picture of the impact of the response. Before the response, the area being treated is consistently worse than the comparison area. After the response, both do about the same. Also, the troublesome November spike seems to be unrelated to the response because it shows up in the control trend, too. The response seems effective, but is not dramatic, so its improvements were easily hidden by factors that need to be controlled - trends, cycles, and unexpected events.


