
Center for Problem-Oriented Policing
POP Center Problems Export Stolen Vehicles Appendix B
Appendix B: Calculating Location Quotients for Crime
The fact that many vehicles are stolen in your area does not necessarily mean you have a theft for export problem; it could simply reflect a generally high rate of crime in your area. One method to better understand whether a theft for export problem exists is to calculate a location quotient for crime (LQC). Crime location quotients allow an analyst to compare the proportion of a particular crime with overall crimes in your jurisdiction and in a larger comparison jurisdiction. If analyzing vehicle theft within a municipality or county, comparisons to state or national averages are advised. By replacing the traditional population-based denominator with overall crimes as the denominator, the LQC determines whether an area has greater or fewer vehicle thefts than one would expect based on overall crime levels. One analysis applied LQCs to national Uniform Crime Reports data to demonstrate that areas in close proximity to Mexico and large ports have substantially higher vehicle thefts than predicted through overall crime.55 Although the location quotient for crime cannot reveal the precise number of vehicles stolen for export, it is a useful tool to apply during the stage in which the analyst is scanning for problems.
If data allow for a distinction to be made between recovered and unrecovered vehicle theft, it is advantageous to use unrecovered vehicle thefts as the numerator and overall crime as the denominator. Therefore, jurisdictions that commonly experience thefts for joyriding or temporary transportation will not have high LQCs; only professional vehicle thefts will then be compared to overall crime.
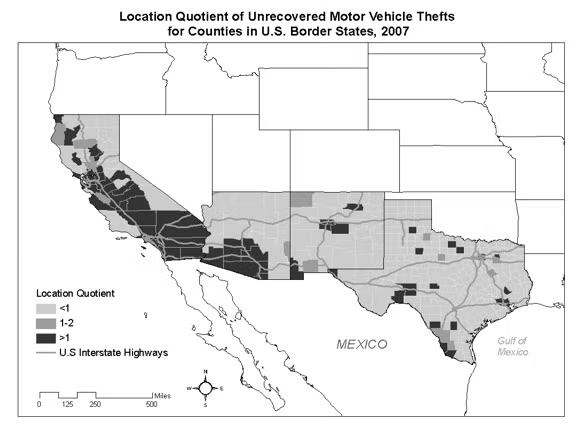
The map in Figure 2 on page 38 illustrates the results of one LQC analysis. It shows that counties bordering Mexico and those that have major highways leading to a busy border crossing have a high crime location quotient value, indicative of a possible theft for export problem in those counties.
To calculate a Location Quotient for Crime, use the following formula:
LQC= (x/y)/(X/Y)
x = the total number of motor vehicle thefts within your jurisdiction
(e.g., municipality or county)
y = the total number of all index crimes within your jurisdiction
X = the total number of motor vehicle thefts within your larger comparison area
Y = the total number of all index crimes within your larger comparison area
Figure 2.
The values obtained from the calculations of the LQC are interpreted as follows:
1.00 – your jurisdiction has an average representation of vehicle theft (or
unrecovered vehicle thefts) compared with all other crimes
> 1.00 – there is an overrepresentation of vehicle theft
< 1.00 – there is an underrepresentation of vehicle theft
Table 1 illustrates a hypothetical example of how LQCs can improve an analyst’s understanding of crime by comparing location quotients to crime rates. When an analyst considers only vehicle theft rates, City B appears to have the largest vehicle theft problem. However, the crime location quotient takes overall crime into account to demonstrate that City C actually has the largest vehicle theft problem relative to its overall crime situation. If your jurisdiction has a high LQC value for vehicle thefts, further steps should be taken to differentiate whether this is likely due to theft for export or other forms of motor vehicle theft.
Table 1. Comparison of Location Quotients for Crime (LQCs) to Motor Vehicle Theft
| MVTs | Population | MVT Rate | Overall Crimes | LQC Value | |
| City A | 250 | 50,000 | 5.0 | 2,500 | 1.0 |
| City B | 400 | 40,000 | 10.0 | 8,000 | 0.5 |
| City C | 250 | 100,000 | 2.5 | 1,250 | 2.0 |
| State Totals | 10,000 | 20,000,000 | 5.0 | 100,000 | ----- |
![]()
![]()