
Center for Problem-Oriented Policing
POP Center Tools Crime & Disorder Hot Spots Page 4
Hot Spot Analysis: Why Are Crime and Disorder Problems Concentrated?
Once hot spots are identified, they must be analyzed to understand the issues that contribute to incident concentrations. This will help police departments select the best responses to the underlying problems contributing to each hot spot. Hot spot analysis is often done in two phases: a preliminary analysis and a more extensive problem-specific analysis.
Preliminary Hot Spot Analysis: What Seems to Be the Problem?
The preliminary analysis of a hot spot should give the department an understanding of what is going on there. This consists of a very basic, fact-finding approach to identifying relevant features of the hot spot. Specifically, it involves detecting basic trends in incident patterns as well as an initial investigation of the physical and social features that contribute to the hot spot. This stage should end with a clear identification of the nature and extent of the problems at each identified hot spot.†
† For more on identifying problems, see Identifying and Defining Policing Problems (Problem-Solving Tools Series, No. 13).
First, it is worth looking at incident trends within hot spots. Doing so can help inform and guide hypotheses surrounding the causes of concentration. Calls for service, incident reports, arrest reports, anonymous drug complaints, and the like can all yield valuable descriptive information about the nature of the hot spots under examination. These data should be carefully examined for commonalities and trends. For instance, a basic analysis of the day and time of events might show that the majority of incidents within the hot spots occur after 3 pm but before 7 pm on weekdays, with few to no events captured at other times or on other days. The timing may suggest that there are activities or conditions associated with businesses, schools, or public spaces (e.g., parks) that might be leading to the troublesome activity within the hot spots.
Second, preliminary analysis often consists of answering basic questions pertaining to physical and social features of the environment. These features can often contribute to crime. Often, places can operate as a crime attractor, crime generator, or crime enabler. This relationship is largely driven by the nature of the place.‡ Common factors explored include land use type (e.g., commercial, residential, mixed), the existence of public spaces or areas (e.g., parks, public parking lots), and other physical features that might be relevant (e.g., bus stops, lighting, fencing). Some types of facilities, by their very nature, create higher risks for unlawful or disorderly conduct at or near them.§
‡ A more detailed discussion of these concepts and their role in crime hot spot development can be found in Crime Analysis for Problem Solvers in 60 Small Steps (Step 17) on the Center for Problem-Oriented Policing website at www.popcenter.org.
§ See Problem-Solving Tool Guide No. 6, Understanding Risky Facilities, for further information.
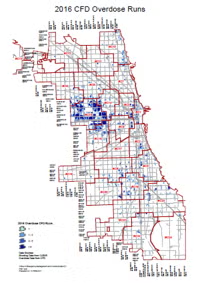
Often factors commonly associated with hot spots are not recorded within the same datasets that are used to locate them. However, there are a number of meaningful data sources that can help uncover the underlying factors contributing to these hot spots. As an illustration, Chicago police correlated a hot spot map of shootings, derived from police data (Figure 4), with a hot spot map of administrations of the heroin-treatment drug Narcan, derived from fire department data (Figure 5), to improve their understanding of the causes of the rise in shootings in certain areas of the city.21 The list below provides examples of the sources and types of data that may be available. This list is not exhaustive, but merely provides examples of the different types of data that can be incorporated to assist with preliminary hot spot analysis.
- Street centerline files
- Transportation (e.g., buses, trains) routes and stops
- Traffic counts
- Land use (e.g., commercial, residential, industrial)
- Alcohol-licensed establishments
- Schools (best to have polygons but points can be used)
- Shopping centers and malls
- Parks (best to have polygons but points can be used)
- Census data on population characteristics
Figure 4: Hot Spot Map of Shootings in Chicago in 2016
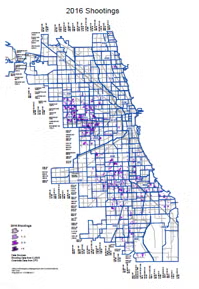
Figure 5: Hot Spot Map of Administrations of Heroin Treatment Drug, Narcan
Not all agencies have access to these data types. However, in addition to the secondary data sources listed above, there are several ways to gain information on the nature of hot spots. Many larger cities provide a data portal of city features (e.g., parks, schools, lakes, bike trails, transportation features). It might also be feasible to collect your own data to help understand the nature of crime hot spots. For instance, systematic observations and coding of the physical and social environment of hot spots can yield helpful information, especially if part of the remedy for the hot spot includes other indicators of success, like reduced physical and social disorder. Additionally, interviews and focus groups with key informants, including community members and business owners, can also help validate what quantitative data suggest and provide contextual information on crime hot spots.
Problem-Specific Analysis: Collecting Information for Action
The next step is to engage in problem-specific analysis. The Problem-Oriented Policing Center has published 73 problem-specific guides to help with problem analysis, as well as response options to specific crime problems.† These guides will help you think about the problems within a crime hot spot more specifically and provide appropriate questions to aid with additional, detailed analysis and assessments. Each guide includes an “Understanding Your Local Problem” section that will help inform a problem-specific analysis.
† See https://popcenter.asu.edu/pop-guides
As an example, after some preliminary analysis, a police analyst has determined that there are three hot spots that appear to be driving high rates of thefts from vehicles at three large retail shopping parking facilities. The preliminary analysis also reveals that these thefts appear to occur primarily on the weekends and tend to be confined to vehicles parked in garages, not in open lots. From there, a more problem-specific inquiry is needed. The Thefts of and From Cars in Parking Facilities guide gives specific, actionable directions on analyzing and responding to auto theft and theft from automobiles in parking facilities.‡ For instance, the guide points to a number of questions on the nature of the events and the conditions leading up to the events to help recognize additional trends. The guide then provides an overview of traditional ways the problem has been addressed and then provides suggestions for problem-specific approaches.
‡ See Theft of and From Cars in Parking Facilities (Problem-Specific Guide No. 10).
![]()
![]()