
Center for Problem-Oriented Policing
POP Center Tools Crime & Disorder Hot Spots Page 3
Hot Spot Identification: Where Are the Problems?
To understand where crime and disorder incidents are concentrated, the incidents need to be associated with a location (e.g., address, street segment, block, neighborhood). While this may seem simple enough, several steps must be considered prior to placing events on a map. Below is a general
guide to the steps for hot spot identification. If your agency employs a crime analyst or has a relationship with an external researcher with crime mapping experience, this individual should be a first point of contact to assist with hot spot identification.†
† For more on the value of crime analysis and crime analysts, see Problem-Solving Tools Guide No. 9, Enhancing the Problem-Solving Capacity of Crime Analysis Units; Crime Analysis for Problem Solvers: In 60 Small Steps; and Matthies and Chiu (2013). For more on crime analysis and identifying hot spots, see the International Association of Crime Analysts (IACA) white paper “Identifying High Crime Areas” at http://www.iaca.net/Publications/Whitepapers/iacawp_2013_02_high_crime_areas.pdf
Hot spots are most often identified using police data—usually calls for service data or incident reports. These data traditionally provide the most specificity about the location of events because they are recorded with a corresponding address, and in some cases with geographic coordinates (e.g., latitude and longitude, x and y coordinates). Furthermore, these data are conveniently available to police departments and arguably best record and represent crime. However, problems and reporting errors often occur in police location data.‡ It is important to be mindful of these errors and to deal with them prior to mapping and analyzing the events.§
‡ Many police datasets have multiple addresses recorded for one event. For example, a dataset may have the address where the crime occurred as well as the address where the crime was reported. When identifying hot spots, use the address or location information for the actual location where the crime occurred, as reporting often takes place later (e.g., an assault where a person left the scene, went home, and then reported the event to police). Another common error is the use of a single street address for a tract of land (e.g., park), which suggests that all events at that park occurred in that one location.
§ In addition to cleaning the data, these entry errors can be minimized by using software features such as spell-check and forced data-entry fields, as well as through in-service training to help officers more accurately report incident locations (Santos 2013).
Think also of other data sources that can help identify hot spots. Emergency medical services data has been used to identify locations of injury incidents unreported to police, specifically violence and drug issues.18 These and other types of data (e.g., disorder complaints from a 311 system or graffiti hotline, school truancy data, emergency room data on gunshot wounds) can be useful in developing a more comprehensive picture of crime and disorder concentrations because they can help reveal locations that are experiencing a higher volume of events, despite low numbers of reports to police.
Once all the relevant data sources have been identified, the data must be cleaned for problem analysis. There are often differences in how two events at the same location are reported (e.g., “1234 George Washington Ave” versus “1234 GW Av”). Appendix A contains a more comprehensive list of common data cleaning issues. Errors like these can affect the number of events associated to that address; therefore, results can be misleading in that the identified hot spots are inaccurate. Overall, data cleaning issues, which are unique to each data source, need to be dealt with prior to mapping and analyzing events.
After the data are adequately cleaned, the crime and disorder events need to be placed on a map. This process is often referred to as geocoding, where the corresponding addresses or, in some cases, the geographic coordinates (e.g., latitude and longitude, x and y coordinates) are used to mark the location of each event. Allocating a point for each event is helpful because it allows for very precise analysis (e.g., identifying a specific address or intersection that is generating many incidents). These points can be aggregated to larger areas of interest (e.g., street segment, block).
In many instances, meaningful information about events is housed in multiple data sources. Once events are located on a map, additional data can be associated with geocoded records through a function known as a join. Two types of joins are commonly used with police data.
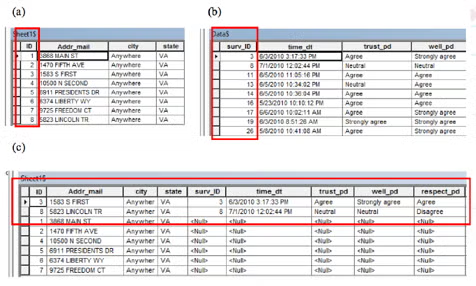
The first are attribute joins. Attribute joins can be done when data about the same incident are located in multiple tables but have a common field (such as an incident number). One example of this would be joining incident data to arrest data based on a common, unique identifier (e.g., case number). Figure 1 demonstrates this concept. Respondent identification information (e.g., respondent ID number and address) for a sample of residents who were sent surveys about attitudes toward police is contained in (a). The information in (b) represents the confidential survey responses collected for each survey participant. Note the data in (b) are not geographic and cannot be mapped because they do not have any geographic identifiers. The goal here is to join the address information to the survey data so that these responses can be inspected visually. The final product of an attribute join produces (c). Note that for surveys that were not returned, the addresses for those sent a survey are retained, but the values for the fields in the survey variables are null.
Figure 1: Visual Example of an Attribute Join
The second type of join is a spatial join. Spatial joins are used when two data sources that share a location or are within a certain proximity. For instance, one approach commonly used in hot spot analysis is a spatial join of the number of crime and disorder events to a street segment. This process is not necessarily linear; joins may need to be performed after hot spots are identified and further investigations of the issues at selected locations are underway.
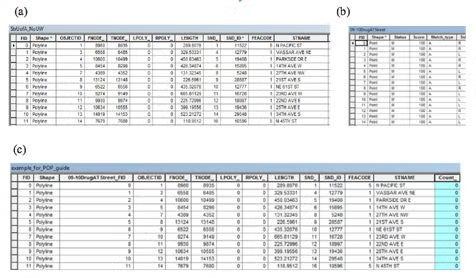
Figure 2 is an illustration of the data behind a spatial join of drug events to street segments. Portion (a) of the figure represents the data for each street block or line within the dataset. The data in (b) represent the data behind each drug event. Note that with a spatial join, no common identifier in each dataset is needed—the join is based on the mapped location of each incident. The results of this spatial join are illustrated in (c). We can see that the number of points was counted for each street segment. The results are contained in the “count” field of (c).
Identifying Hot Spots
The best approach to hot spot identification will vary based on department priorities and available data. For example, a broader approach to hot spot identification would be to locate all the hot spots using computer-aided dispatch (CAD) and records management system (RMS) data to understand the spatial trends of incidents throughout a jurisdiction. However, depending on the problem at hand, a narrower approach may be needed. For instance, maybe there are only one or two incident types that are of interest. Or the identification approach could focus on problem hot spots related to a specific incident type at a predetermined location (e.g., park, campus, neighborhood).
Additionally, identifying hot spots is often driven by the type of data available. Data that provide more specific information, like addresses, can be used to understand policing issues at very small places but can also be used to identify larger problem areas, like a beat, service area, district, or community because it can be aggregated to these larger locations. Conversely, if address- or coordinate-level data are not available, there are limitations to the type of techniques that can be used for hot spot identification. For instance, it is impossible to generate accurate street segment hot spots if the only data available are incident counts within a larger area (or polygon) like a block, neighborhood, or patrol area. A visual example of a street segment hot spot map is provided in Figure 3.
Figure 2: Visual Example of a Spatial Join
There is a great deal of information available on identifying and generating hot spots.19 Appendix B provides a summary chart that features the different types of hot spot mapping techniques and their appropriate use, followed by examples of each type of map.
Although maps that use larger areas to display incident concentrations can be helpful (a common practice when using choropleth and isoline maps—see Appendix B), they also present issues that make it difficult to effectively analyze the specific problem and implement targeted responses. Given the limitations of using larger areas, hot spot identification should, when possible, begin with techniques that use smaller locations or areas to improve the precision of targeted responses. Studies demonstrate the variability of hot spots within larger geographies and highlight potential errors and oversights associated with using larger areas to identify hot spots.20
Additionally, the type of hot spot maps discussed and demonstrated above are not mutually exclusive approaches; they often can and should be used together. For instance, there may be situations where it is meaningful and appropriate to examine addresses that experience high volumes of crime events within a street segment that is also highly concentrated with crime. One address might be the catalyst for the crime problem at the street level, but the problem could extend beyond that location and the street segment could contain other characteristics (e.g., crime generators, crime attractors) that contribute to crime there. Conversely, using multiple hot spot identification techniques can help narrow the geographic focus for problem-solving efforts. For instance, if the problem calls for targeting an issue that is unique to one or two neighborhoods, further examination of the incident concentrations at smaller places (isoline maps), street segments (line maps), or specific addresses (point or graduated symbol maps) can help demonstrate, with more precision, the locations that are generating most of the problem. This information is invaluable for narrowing the focus for additional analysis as well as identifying the appropriate problem-specific response.
Figure 3: Distribution of Drug Crime Incidents in Seattle, Washington, 2004
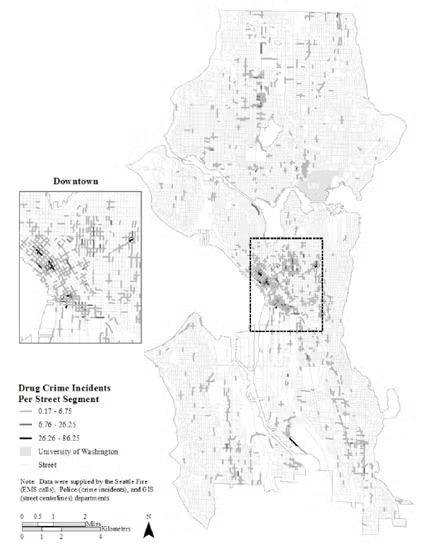
Note: Map originally presented by Hibdon and Groff (2014).
![]()
![]()