In any large city just a handful of bars give the police far more trouble than all the rest put together. The same is true of many other types of establishments, such as schools, convenience stores, and parking lots. In each case, just a few produce far more crime, disorder, and calls for police assistance than the rest of the group combined. This phenomenon—called “risky facilities”—has important implications for many problem-oriented policing projects. In particular, it can help police focus their energies where they are needed most and can help in selecting appropriate preventive measures. This guide serves as an introduction to risky facilities and shows how the concept can aid problem-oriented policing efforts by providing answers to the following key questions.
We open with a definition of facilities and provide some examples. We then discuss risky facilities and explain how this concept is related to other crime concentration theories.
Facilities are places with specific public or private functions, such as stores, bars, restaurants, mobile home parks, bus stops, apartment buildings, public swimming pools, ATM locations, libraries, hospitals, schools, parking lots, railway stations, marinas, and shopping malls.
Facilities vary greatly in the crimes they experience. Medical facilities, for example, are likely to have different types and levels of crime than do police booking facilities. In addition, there is likely to be a great variation within any broad category of facility. For example, although both are medical facilities, dental offices are likely to have different levels and types of crime than are emergency rooms. Because such distinctions are critical to the success of risky facility analyses, it is important to begin by carefully defining the type of facility that is to be examined; only then proceed to an examination of the type and frequency of crime that the particular type of facility experiences.
One important principle of crime prevention holds that crime is highly concentrated among particular people, places, and things; as this principle suggests, focusing resources on these concentrations is likely to yield the greatest preventive benefits. This principle has spawned a number of related concepts that are routinely used by police in problem-solving projects, including:
Risky facilities is another recently described theory of crime concentration that holds great promise for problem-oriented policing.1 The theory postulates that only a small proportion of any specific type of facility will account for the majority of crime and disorder problems experienced or produced by the group of facilities as a whole.
As a rule of thumb, about 20 percent of the total group will account for 80 percent of the problems. This is known as the 80/20 rule: in theory, 20 percent of any particular group of things is responsible for 80 percent of outcomes involving those things.2 The 80/20 rule is not peculiar to crime and disorder; rather, it is almost a universal law. For example, a small portion of the earth’s surface holds the majority of life on the planet; a small proportion of earthquakes cause most earthquake damage; a small number of people hold most of the earth’s wealth; a small proportion of police officers produce the most arrests; and so forth. In practice, of course, the proportion is seldom exactly 80/20; however, it is always true that some small percentage of a group produces a large percentage of any particular result involving that group. Later in the guide we will show you how to determine whether the 80/20 rule holds true for any particular group of facilities.
The 80/20 rule can be a useful initial assumption: when confronting a problem, start by assuming that most of the problem is created by a few individuals, places, or events. Although this first approximation is not always correct, it is probably correct more often than assuming that the problem is spread evenly across individuals, places, or events. Careful analysis can then test whether this starting assumption is correct.
The first paper to discuss the concept of risky facilities identified nearly 40 studies of specific types of facilities that included data about variations in the risks of crime, disorder, or misconduct.3 These studies covered a wide range of facilities and many different types of crime and deviance, including robbery, theft, assault, and simple disorder. All the studies showed wide variations in risk in the facilities studied and in many there was clear evidence of high concentrations of risk consistent with the definition of risky facilities.† There follow a few examples.
† Not every study provided clear evidence that a small proportion of the facilities accounted for a large proportion of the crime, disorder, or misconduct. Rather, some reported differences between facilities in crime numbers or rates; for example, Matthews, Pease & Pease (2001) [PDF] reported that “4 percent of banks had robbery rates four to six times that of other banks.” Although consistent with the concept of risky facilities, these figures do not satisfy a key component of the definition: they do not demonstrate that a small number of high-risk banks accounted for a large part of the robbery problem. However, this does not mean that risks for the facilities studied were not highly skewed. Rather, it only means that the data did not allow the distribution of risk to be examined.
Although the studies in this list are just a few of those that have produced evidence of risky facilities, such results make it clear that this form of crime concentration is quite widespread.
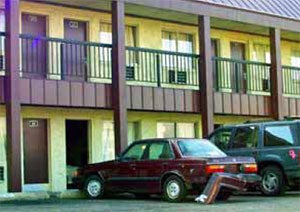
Low Cost Motel: The risk of crime varies a great deal among facilities of the same type. Photo Credit: John Eck
When analysts plot the number of crimes at each facility under investigation, they almost always create a graph with a reclining-J shape. This can be seen in the example in Figure 1, based on the work of crime analysts in Chula Vista, California. In that study, all parks over two acres in Chula Vista were ranked from the most crime (on left) to the least. The heights of the bars show the number of crimes in each park. As can be seen, three parks had far more crime than any of the rest and most parks had very little crime.

Risky facilities can show up as hot spots on a city’s crime map. Indeed, specific hospitals, schools, and train stations are often well-known examples. But simply treating these facilities as hot spots misses an important analytical opportunity: comparing the risky facilities with other like facilities. Such a comparison can reveal important differences between facilities that can account for the differences in risk, thereby providing important pointers to preventive action.
In addition, risky facilities are sometimes treated as examples of repeat victimization. However, this can create confusion when it is not the facilities that are being victimized, but rather the people who are using them. Thus, a tavern that repeatedly requests police assistance in dealing with fights is not itself being repeatedly victimized, unless it routinely suffers damage in the course of these fights or if members of staff are regularly assaulted. Even those participating in the fights may not be repeat victims, as different patrons might be involved each time. Indeed, no one need be victimized at all, as would be the case if the calls were about drugs, prostitution, or stolen property sales. Calling the tavern a repeat victim can be more than just confusing, however, because it might also divert attention from the role mismanagement or poor design plays in causing the fights. By keeping the concepts of repeat victimization and risky facilities separate, it may be possible to determine whether or not repeat victimization is the cause of a risky facility and thereby to design responses accordingly.
The concept of risky facilities can be helpful in two types of policing projects. First, the concept can be useful in crime prevention projects that focus on a particular class of facilities, such as low rent apartment complexes or downtown parking lots. In the scanning stage, the objective is to list the facilities involved along with the corresponding number of problem incidents in order to see which facilities experience the most and which the fewest problems. This might immediately suggest some contributing factors. For example, a study of car break-ins and thefts in downtown parking facilities in Charlotte, North Carolina revealed that the number of offenses in each parking lot was not merely a function of size.14 Rather, it was discovered that some smaller facilities experienced a large numbers of thefts because of some fairly obvious security deficiencies. This finding was explored in more depth in the analysis stage by computing theft rates for each facility based on its number of parking spaces. The analysis found that the risk of theft was far greater in surface lots than in parking garages, a fact that had not been known previously. Subsequent analysis compared security features between the multilevel and surface lots and then within the members of each category in an effort to determine which aspects of security (e.g., attendants, lighting, security guards) explained the variation. This analysis guided the selection of measures that were to have been introduced at the response stage; and had these been implemented as planned (which was not the case), the assessment stage would have examined, not merely whether theft rates declined overall, but whether those at the previously riskiest facilities had declined most. Obviously, this type of analysis can be conducted within any group of facilities.
Second, risky facilities analysis can be helpful to crime prevention efforts that focus on a particular troublesome facility. In this sort of analysis, the scanning stage consists of comparing the problems at a particular facility with those at similar nearby facilities. For example, in a project that won the Herman Goldstein Award for Excellence in Problem-oriented Policing in 2003, 15 police in Oakland, California discovered that a particular motel experienced nearly 10 times as many criminal incidents as did any other comparable motel in the area. Although in this case the analysis convinced Oakland police to address the problems at the motel in question, in other cases analysis might reveal that some other facilities have far greater problems than the one which was the initial focus of the project. Comparing the facility being addressed in the project with other group members can also be useful in the analysis, response, and assessment stages described above.
Police reports and calls for service data are the most common sources of information about crime and disorder events. However, using these data can lead to errors if care is not taken to check for some of the following potential problems.†
† Many of these data problems are also encountered when studying hot spots and repeat victimization. For further information see Deborah Weisel (2005), Analyzing Repeat Victimization, Problem Solving Tools Series No. 4.
Incident reporting forms and police records can be revised to improve geographical information gathering; moreover, the increased use of geocoding for crime reports will gradually help resolve some of these difficulties.
A study in England in 1964 found that absconding rates for residents in 17 training schools for delinquent boys ranged from 10 percent to 75 percent. To determine whether this variation was random, researchers reexamined the absconding rates two years later (1966) to see if the variation was much the same. They found that by and large the variation was consistent between the two years. For example, School 1 had the lowest absconding rate and School 17 the highest rate in both years (see the table below). In fact, the correlation was 0.65 between the two years.† Because the variation was relatively stable and because very few boys would have been residents in both years, researchers determined that the variation was probably due to differences in management practices rather than to differences in the student populations.
† Correlation coefficients can be calculated quite simply from an Excel spreadsheet.
| Training School | Absconding Rate | |
|---|---|---|
| 1964 | 1966 | |
| 1 | 10% | 10% |
| 2 | 13% | 38% |
| 3 | 14% | 14% |
| 4 | 21% | 18% |
| 5 | 21% | 23% |
| 6 | 22% | 14% |
| 7 | 22% | 21% |
| 8 | 24% | 29% |
| 9 | 25% | 33% |
| 10 | 26% | 37% |
| 11 | 27% | 25% |
| 12 | 28% | 47% |
| 13 | 29% | 45% |
| 14 | 32% | 43% |
| 15 | 34% | 26% |
| 16 | 46% | 27% |
| 17 | 75% | 50% |
Adapted from: Clarke and Martin (1975).
Once a satisfactory measure of the problematic events for a defined group of facilities has been obtained, the following six-step procedure can be used to determine whether the 80/20 rule applies.
† Reproduced with permission from Clarke and Eck (2003)
In order to analyze crime concentrations, it is first necessary to define the type of facility to be examined; only then is it possible to create a list of facilities that meets that the definition. Ideally, all places that fit the definition and that are in the area of study will be on the list once and only once. In addition, facilities that do not fit the definition will not be on the list. The further the list departs from this ideal, the more likely it is that the results will be misleading.
Identifying all facilities of a particular type in any given area can be troublesome: not only can it sometimes be difficult to develop an appropriate working definition of the type of facility at issue, but problems can also arise in regard to the data management practices of relevant public and private agencies.
Here is an example of creating a list of facilities that illustrates these points. A research team at the University of Cincinnati, Ohio wanted to determine why a few bars had numerous violent incidents, whereas most of the others had none or only a very few. To do this, they needed a definition of “bar” and a list of facilities that met this definition.
Researchers defined “bar” as a place that met four conditions: (1) it had to be open to the general public, rather than restricted to members or rented out to private parties; (2) it had to serve alcohol for onsite consumption; (3) some patrons had to come to the place for the primary purpose of consuming alcohol; and (4) there had to be a designated physical area within the place that served as a drinking area. Locations that did not meet all four conditions were excluded from the study.
To obtain a list of locations meeting this definition, researchers began by consulting records from the Ohio Division of Liquor Control. These records showed that 633 places within the city limits were licensed to serve hard liquor. Based upon their personal knowledge, researchers were able to exclude a number of locations from consideration, reducing the list to 391 possible bars. To isolate the real bars, researchers then compared the remaining locations to the most recent bar guide in a local weekly tabloid that catered to young adults, which contained both a brief written description of the locations and numerous commercial advertisements. The tabloid information revealed that at least 198 of the 391 places fit the definition used. The tabloid list was incomplete, however, as there were an unknown number of city bars that were not reviewed by the tabloid staff. A check of the online Yellow pages verified several more bars. Private fraternal organizations were eliminated from consideration because they were not open to the general public. For most of the remaining places, researchers phoned or visited the sites, examining the physical locations and interviewing owners and employees. Onsite visits revealed several restaurants had areas that looked like bars, but these were eventually eliminated from consideration when it became clear from interviews that they were more decorative than functional or that they were used for other purposes (e.g., to hold carryout orders for customer pickup or to provide overflow seating where customers could eat). Ultimately, researchers identified 264 facilities that fit the definition of bar. These then became the subjects of the study.
Table 1: The Distribution of 121 Assaults in 30 Pubs
| No. of Assaults | % of Assaults | Cumulative % Assaults | Cumulative % Pubs | |
|---|---|---|---|---|
| White Hart | 31 | 25.6 | 25.6 | 3.3 |
| Union | 17 | 14.0 | 39.7 | 6.7 |
| Feathers | 13 | 10.7 | 50.4 | 10.0 |
| Wellington | 11 | 9.1 | 59.5 | 13.3 |
| Black Prince | 8 | 6.6 | 66.1 | 16.7 |
| Angel | 7 | 5.8 | 71.9 | 20.0 |
| George & Dragon | 6 | 5.0 | 76.9 | 23.3 |
| Cross Keys | 6 | 5.0 | 81.8 | 26.7 |
| Saracen's Head | 4 | 3.3 | 85.1 | 30.0 |
| White Bear | 4 | 3.3 | 88.4 | 33.3 |
| Mason's Arms | 3 | 2.5 | 90.9 | 36.7 |
| Cock | 3 | 2.5 | 93.4 | 40.0 |
| Badger | 3 | 2.5 | 95.9 | 43.3 |
| Hare & Hounds | 1 | 0.8 | 96.7 | 46.7 |
| Red Lion | 1 | 0.8 | 97.5 | 50.0 |
| Royal Oak | 1 | 0.8 | 98.3 | 53.3 |
| George | 1 | 0.8 | 99.2 | 56.7 |
| Cross Hands | 1 | 0.8 | 100 | 60.0 |
| Rose & Crown | 0 | 0 | 100 | 63.3 |
| King’s Arms | 0 | 0 | 100 | 66.7 |
| Star | 0 | 0 | 100 | 70.0 |
| Mitre | 0 | 0 | 100 | 73.3 |
| Dog and Fox | 0 | 0 | 100 | 76.7 |
| Griffin | 0 | 0 | 100 | 80.0 |
| Plough | 0 | 0 | 100 | 83.3 |
| Queen’s Head | 0 | 0 | 100 | 86.7 |
| White Horse | 0 | 0 | 100 | 90.0 |
| Bull | 0 | 0 | 100 | 93.3 |
| Swan | 0 | 0 | 100 | 96.7 |
| Black Bear | 0 | 0 | 100 | 100 |
Because there is no single reason why facilities vary in risk, it is important to determine which reasons are in operation in each particular case. The most important sources of variation in risk follow.
Table 2: Reported Shopliftings by Store, Danvers, Mass. October 2003 to September 2004
| Store | Shopliftings | Percent of Shopliftings | Cumulative % of Shopliftings | Cumulative % of Stores | Shopliftings per 1000 Sq. Ft. |
|---|---|---|---|---|---|
| 1 | 78 | 26.2 | 26.2 | 1.3 | 1.54 |
| 2 | 42 | 14.1 | 40.3 | 2.6 | 0.70 |
| 3 | 28 | 9.4 | 49.7 | 3.8 | 0.22 |
| 4 | 16 | 5.4 | 55.0 | 5.1 | 0.24 |
| 5 | 15 | 5.0 | 60.1 | 6.4 | 0.28 |
| 6 | 12 | 4.0 | 64.1 | 7.7 | 0.31 |
| 7 | 11 | 3.7 | 67.8 | 9.0 | 0.09 |
| 8 | 11 | 3.7 | 71.5 | 10.3 | 0.16 |
| 9 | 9 | 3.0 | 74.5 | 11.5 | 0.28 |
| 10 | 7 | 2.3 | 76.8 | 12.8 | 2.82 |
| 11 | 5 | 1.7 | 78.5 | 14.1 | 0.16 |
| 12 | 5 | 1.7 | 80.2 | 15.4 | 0.10 |
| 13 | 4 | 1.3 | 81.5 | 16.7 | 0.35 |
| 14 | 4 | 1.3 | 82.9 | 17.9 | 0.12 |
| 15 | 3 | 1.0 | 83.9 | 19.2 | 3.32 |
| 16 | 3 | 1.0 | 84.9 | 20.5 | 0.90 |
| 17 | 3 | 1.0 | 85.9 | 21.8 | 0.02 |
| 7 stores with 2 incidents | 14 | 4.7 | 90.6 | 30.8 | 0.08 |
| 28 stores with 1 incident | 28 | 9.4 | 100.0 | 66.7 | 0.06 |
| 26 stores with 0 incidents | 0 | 0.0 | 100.0 | 100.0 | 0.00 |
| Total stores = 78 | 298 | 100.0 | 100.0 | 100.0 | 0.15 |
Unfortunately, it is not always easy to obtain the data needed to correct for the size of the facilities under study. For example, a study of downtown parking lot thefts in Charlotte, North Carolina was impeded when the city was unable to provide data about the number of spaces in each lot.16 As a result, police officers had to visit each lot and count the spaces by hand.
† See Clarke, Ronald (1999) [PDF] . Hot Products. Police Research Series. Paper 112. London: Home Office.
† See Mike Scott, The Problem of Robbery at Automated Teller Machines, Problem Specific Guide No. 8 (Washington, D.C.: Office of Community Oriented Policing Services, U.S. Department of Justice, 2001).
†† See Ronald Clarke, Shoplifting, Problem Specific Guide No. 11 (Washington, D.C.: Office of Community Oriented Policing Services, U.S. Department of Justice, 2022).
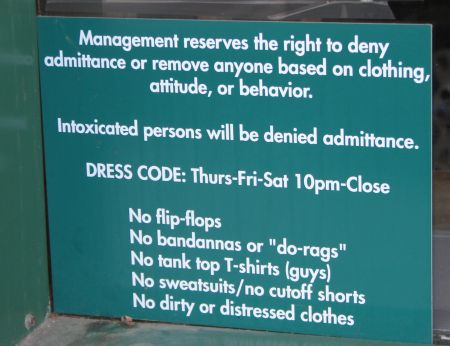
A Sign Outside a Bar – How managers regulate patron conduct can have a big influence on crime risk. Credit: John Eck
In every large city, a few low-cost rental apartment buildings make extraordinary demands on police time. These “risky facilities” are often owned by slumlords — unscrupulous landlords who purchase properties in poor neighborhoods and who make a minimum investment in management and maintenance. Building services deteriorate, respectable tenants move out, and their place is taken by less respectable ones — drug dealers, pimps, and prostitutes — who can afford to pay the rent but who cannot pass the background checks made by more responsible managements. In the course of a problem-oriented policing project in Santa Barbara, California, Officers Kim Frylsie and Mike Apsland analyzed arrests made at 14 rental apartment buildings owned by a slumlord, before and after he had purchased them. The table clearly shows a large increase in the number of people arrested at the properties in the years after he acquired them. There was also some evidence that the increased crime and disorder in these properties spilled over to infect other nearby apartment buildings — a finding that supports the widespread belief that slumlords contribute to neighborhood blight.
| Property | Year Aquired | No. of Units | Average Pre-Owning | Yearly Arrests Post-Owning |
|---|---|---|---|---|
| 1 | 1977 | 4 | 0 | 1.6 |
| 2 | 1982 | 15 | 0 | 16.9 |
| 3 | 1983 | 8 | 0 | 2.3 |
| 4 | 1985 | 8 | 0 | 4.5 |
| 5 | 1985 | 10 | 0.1 | 6 |
| 6 | 1986 | 16 | 0.2 | 27.9 |
| 7 | 1986 | 6/8 | 0 | 3.4 |
| 8 | 1987 | 5 | 0 | 8.3 |
| 9 | 1987 | 12 | 0 | 11.3 |
| 10 | 1988 | 6 | 0.4 | 8.1 |
| 11 | 1991 | 10 | 0.2 | 9.3 |
| 12 | 1991 | 10+ | 2.3 | 21.8 |
| 13 | 1992 | 4+ | 1.1 | 0.7 |
| 14 | 1992 | 4 | 0.2 | 10.7 |
Source: Clarke, Ronald and Gisela Bichler-Robertson (1998). “Place Managers, Slumlords and Crime in Low Rent Apartment Buildings”. Security Journal, 11: 11-19.
Table 3: Responses to Risky Facilities
| Cause | Description | Responses |
|---|---|---|
| Size | Facility is large and attracts many users, some of whom become victims. | If the number of crimes per user is very small compared to most other facilities, then one option is to do nothing. Alternatively, identify those most likely to become victims and the circumstances associated with their victimization, then focus on these individuals and circumstances. |
| Hot Products | Facility contains a large number of things that are particularly vulnerable to theft or vandalism. | Remove hot products. Provide additional protection to hot products. |
| Location | Facility may be located in close proximity to offenders. | Hire additional security. Tailor management practices to the peculiarities of the area. |
| Repeat Victims | Facility contains a few victims who are involved in a large proportion of crimes. | Provide victims with the information or inducements they need to make behavioral changes that will reduce their likelihood of victimization. Provide information or protection to victims so that they are not victimized again. |
| Crime Attractor | Facility attracts many offenders or a few high rate offenders. | Remove offenders through enforcement and incapacitation or rehabilitation. Deny access to repeat offenders. |
| Poor Design | Physical layout makes offending easy, rewarding or inducing risk. | Change the physical layout in conformity with principles of Crime Prevention through Environmental Design (CPTED)†. |
| Poor Management | Management practices or processes enable or encourage offending. | Change management procedures, paying particular attention to practices that influence repeat victimization. |
† For additional information on CPTED principles see Response Guide #6.
There is no single reason that explains why some facilities have far more crime than other facilities of the same type. Rather, the full explanation usually involves a combination of the seven factors discussed above; remember though, that the relative contribution of each will vary from case to case. In many problem-oriented projects it might not be possible to explain completely the variations in risk between facilities, because such analysis is usually only possible after detailed research that can take weeks or months to complete. However, it is usually possible to get some idea of how each of the seven factors contributes to the problem by comparing high and low crime facilities. We previously explained how to do this when we discussed the various ways of testing the influence of location, hot products, repeat victimization and crime attractors. In some cases, quantitative data such as facility size will be readily available. In others, it might be necessary to survey the facilities to discover the relevant information. For example, in the project mentioned above that focused on thefts from cars in Charlotte’s downtown parking facilities, police surveyed the lots to gather information about hours of operation, attendants, fencing, lighting, and other security measures. This provided many ideas for reducing crime in the riskiest facilities. In another Charlotte study, a police survey found that the theft of household appliances from construction sites was much lower when builders delayed installation until the homes were ready for occupancy. 19
Direct observation and discussions with managers and police familiar with the facilities (see Box 4) can yield valuable insights into the reasons for variations in risk between facilities. In addition, interviews with apprehended offenders can reveal how they evaluate the difficulties, rewards, and risks of preying upon the facilities in the sample.† Similarly, interviews with victims—particularly repeat victims—can be revealing.
† See Scott Decker, Using Offender Interviews to Inform Police Problem Solving, Problem Solving Tools Series No. 3 (Washington, D.C.: Office of Community Oriented Policing Services, 2005).
In Newark, New Jersey, a project funded by the U.S. Department of Justice Office of Community Oriented Policing Services (the COPS Office) focused on drug dealing in low cost private rental apartment complexes. 20 During the scanning stage, 22 possible sites for intervention (out of a total of 506 private apartment complexes) were identified through an analysis of police data and interviews with officers in the Newark Police Department’s Safer Cities Task Force and Special Investigations Unit. Subsequent interviews with district commanders revealed a special problem with four apartment complexes located close to entry and exit ramps for Interstate 78, which provided out-of-town buyers with easy access to drug markets. The buyers could briefly enter the city, purchase drugs at the complexes, drive around in a loop and quickly exit again. Authorities implemented a traffic management plan that disrupted the loop by creating one-way streets and dead-ends. The traffic plan was reinforced with additional enforcement at the four sites and will eventually dovetail with a long-term project by the state to rebuild the ramps to route traffic away from residential areas.
Your ability to understand the reasons for the variations in risk will be greatly assisted where there is an existing Problem-Oriented Policing Guide that deals with the facilities that are the focus of your own project. Although it will not tell you which factors are important in your sample, it will provide more specific suggestions than are provided by the general discussion above.
As of June, 2006, ten guides focused on problems within specific types of facilities.†
† New guides are constantly being added; a list of those in preparation is available at www.popcenter.org.
Although there are many ways to reduce risk (see Table 3), it is important to focus on those that are most likely to succeed. For example, it is usually impossible to do anything about the size and location of specific facilities. Similarly, changing a facility’s physical design can be difficult or costly and would only be justified in an extreme case. On the other hand, it may be easier to change business practices that facilitate or encourage crime and disorder; this, however, cannot be done without the full cooperation of those who own or manage the facilities, as they are usually the ones who must implement and pay for the measures. Before moving on to a discussion of the various ways of convincing facility managers to make the changes necessary to reduce crime or disorder, it is important to understand some of the reasons why they might not have done these things on their own. The reasons can include the following.
Although it always best to assume that managers and owners want to reduce crime and disorder in their facilities and that they will be open to working with the police and others to implement the necessary changes, the list above suggests that they will sometimes resist implementing remedial measures. Consequently, it will sometimes be necessary to exert a certain amount of coercion, either directly or indirectly. There are several ways that this can be done. †
† See Clarke, Ronald (1999) [PDF] . Hot Products. Police Research Series. Paper 112. London: Home Office. (Accessible at www.popcenter.org)
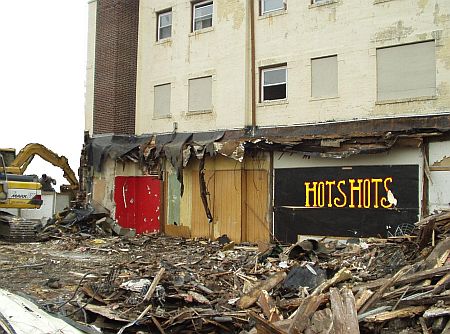
Demolition of a Former Bar and Drug Dealing Hot Spot: Removing a very risky facility can be the best way to reduce crime Credit: John Eck
Table 4: Calls for Police Service Oakland Airport Motel
| Year | Calls for Service |
|---|---|
| 1998 | 197 |
| 1999 | 212 |
| 2000 | 242 |
| 2001 | 38 |
| 2002 | 1 |
| 2003 | 3* |
| *Through March 2003 | |
In practice, a combination of approaches—both a carrot and a stick—might be the most effective strategy. Because business owners can be politically powerful, it may be far easier to reduce crime if management is induced to cooperate without engaging in a political battle. In this regard, it is important to recall the guiding principle of this guide, the 80-20 rule: most of the problem is likely to be the result of a few facilities. So it might be that enlisting the support of the majority of facility owners and managers—whose contributions to the problem are minor—to change the behavior of the few—whose contributions to the problem are major—can aid police in winning the political struggle. This can also reduce costs by focusing resources where they are needed most, which can aid in tailoring responses to particular settings, thereby increasing the chances that interventions will be effective.
[1] Eck, Clarke and Guerette. (2007) [Full Text].
[2] Kock (1999).
[3] Eck, Clarke and Guerette. (2007) [Full Text].
[4] National Association of Convenience Stores (1991).
[5] Sherman, Schmidt, and Velke (1992).
[6] Eck, Clarke and Guerette (2007) [Full Text].
[7] La Vigne (1994) [Full Text].
[8] Lindstrom (1997).
[9] Bowers et al. (1998).
[10] Hirschfield and Bowers (1998).
[11] Newton (2004); Loukaitou-Sideris and Eck (in press).
[12] Perrone (2000). [Full text]
[13] Eck, Clarke and Guerette (2007) [Full Text].
[14] Clarke and Goldstein (2003) [Full Text].
[15] Oakland Police Department (2003) [Full Text].
[16] Clarke and Goldstein (2003) [Full Text].
[17] Chula Vista Police Department (2004).
[18] Madensen et al. (2005).
[19] Clarke and Goldstein (2002) [Full Text].
[20] Zanin et al. (2004) [Full Text].
[21] Eck (2002).
[22] Smith, Gregson and Morgan (2003). [Full text]
[23] Homel et al. (1997); Felson et al. (1997) [Full Text].
[24] Chula Vista Police Department (2004).
[25] Oakland Police Department (2003) [Full Text].
Bowers, K., A. Hirschfield and S. Johnson (1998). “Victimization Revisited: A Case Study of Non-Residential Repeat Burglary in Merseyside.” British Journal of Criminology 38(3): 429-452.
Chula Vista Police Department. Chief’s Community Advisory Committee (2004). The Chula Vista Motel Project. Chula Vista, Calif.: Chula Vista Police Department.
Clarke, R.V. (1999). Hot Products: Understanding, Anticipating and Reducing Demand for Stolen Goods. Police Research Series, Paper 112. London: Home Office, Research Development and Statistics Directorate. [Full Text]
---- (2002). Shoplifting. Problem-Oriented Guides for Police Series; Problem-Specific Guide No. 11. Washington, D.C.: U.S. Department of Justice, Office of Community Oriented Policing Services. [Full Text]
Clarke, R.V., and G. Bichler-Robertson (1998). “Place Managers, Slumlords and Crime in Low Rent Apartment Buildings.” Security Journal 11(1): 11-19.
Clarke, R.V., and J.E. Eck (2003). Become a Problem-Solving Crime Analyst: In 55 Small Steps. London: Jill Dando Institute of Crime Science. [Full text]
Clarke, R.V., and H. Goldstein (2002). “Reducing Theft at Construction Sites: Lessons from a Problem-Oriented Project.” In N. Tilley (ed.), Analysis for Crime Prevention, Crime Prevention Studies, Vol. 13. Monsey, N.Y.: Criminal Justice Press. [Full Text]
---- (2003). “Thefts from Cars in Center-City Parking Facilities: A Case Study in Implementing Problem-Oriented Policing.” In J. Knutsson (ed.), Problem-Oriented Policing: From Innovation to Mainstream, Crime Prevention Studies, Vol. 15. Monsey, N.Y.: Criminal Justice Press. [Full Text]
Clarke, R.V., and D. Martin (1975). “A Study of Absconding and Its Implications for the Residential Treatment of Delinquents.” In J. Tizard, I. Sinclair and R.V. Clarke (eds.), Varieties of Residential Experience. London: Routledge and Kegan Paul.
Decker, S. (2005) Using Offender Interviews to Inform Police Problem Solving, Problem-Oriented Guides for Police Series, Problem Solving Tools Series No. 3 Washington, D.C.: U.S. Department of Justice, Office of Community Oriented Policing Services. [Full Text]
Eck, J.E. (2002). “Preventing Crime at Places.” In L.W. Sherman, D. Farrington, B. Welsh and D.L. MacKenzie (eds.), Evidence-Based Crime Prevention. New York: Routledge.
---- (2003). “Police Problems: The Complexity of Problem Theory, Research and Evaluation.” In J. Knutsson (ed.), Problem-Oriented Policing: From Innovation to Mainstream, Crime Prevention Studies, vol. 15. Monsey, N.Y.: Criminal Justice Press. [Full text]
Eck, J., R.V. Clarke and R. Guerette (2007). “Risky Facilities: Crime Concentration in Homogeneous Sets of Facilities.” Crime Prevention Studies, Vol.21. Monsey, N.Y.: Criminal Justice Press. [Full Text]
Felson, M., R. Berends, B. Richardson and A. Veno (1997). “Reducing Pub Hopping and Related Crime.” In R. Homel (ed.), Policing for Prevention: Reducing Crime, Public Intoxication and Injury, Crime Prevention Studies, vol. 7. Monsey, N.Y.: Criminal Justice Press. [Full Text]
Hirschfield, A., and K. Bowers (1998). “Monitoring, Measuring and Mapping Community Safety.” In A. Marlow and J. Pitts (eds.), Planning Safer Communities. Lyne Regis: Russell House Publishing.
Homel, R., M. Hauritz, G. McIlwain, R. Wortley and R. Carvolth (1997). “Preventing Drunkenness and Violence Around Nightclubs in a Tourist Resort.” In R.V. Clarke (ed.), Situational Crime Prevention: Successful Case Studies (2nd ed.). Guilderland, N.Y.: Harrow and Heston.
Kock, R. (1999). 80-20 Principle: The Secret to Success by Achieving More with Less. New York: Doubleday.
La Vigne, N. (1994). “Gasoline Drive-Offs: Designing a Less Convenient Environment.” In R.V. Clarke (ed.), Crime Prevention Studies, Vol. 2. Monsey, N.Y.: Criminal Justice Press. [Full Text]
Lindstrom, P. (1997). “Patterns of School Crime: A Replication and Empirical Extension.” British Journal of Criminology 37(1): 121-130.
Loukaitou-Sideris, A., and J.E. Eck (in press). “Crime Prevention and Active Living.” American Journal of Health Promotion.
Madensen, T., M. Skubak, D. Morgan and J.E. Eck (2005). Open-Air Drug Dealing in Cincinnati, Ohio: Executive Summary and Final Recommendations. Cincinnati, Ohio: University of Cincinnati, Division of Criminal Justice. Available at www.uc.edu/criminaljustice/ProjectReports/ FINAL_ RECOMMENDATIONS.pdf)
Matthews, R., C. Pease and K. Pease (2001). “Repeat Bank Robbery: Theme and Variations.” In G. Farrell and K. Pease (eds.), Repeat Victimization. Crime Prevention Studies, Vol.12. Monsey, N.Y.: Criminal Justice Press. [Full Text]
National Association of Convenience Stores (1991). Convenience Store Security Report and Recommendations. Alexandria, Va.: National Association of Convenience Stores.
Newton, A. (2004). Crime and Disorder on Busses: Toward an Evidence Base for Effective Crime Prevention. PhD dissertation, University of Liverpool.
Oakland Police Department (2003). “The Oakland Airport Motel Project.” Submission for the Herman Goldstein Award for Excellence in Problem-Oriented Policing. [Full Text]
Perrone, S. (2000). Crimes Against Small Business in Australia: A Preliminary Analysis. Trends & Issues in Crime and Criminal Justice, No. 184. Canberra: Australian Institute for Criminology. [Full text]
Scott, M. (2001). The Problem of Robbery at Automated Teller Machines. Problem-Oriented Guides for Police Series, Problem Specific Guide No. 8. Washington, D.C.: U.S. Department of Justice, Office of Community Oriented Policing Services. [Full text]
Scott, M., and H. Goldstein (2005). Shifting and Sharing Responsibility for Public Safety Problems. Problem-Oriented Guides for Police, Response Guide Series No. 3 Washington, D.C.: U.S. Department of Justice, Office of Community Oriented Policing Services. [Full text]
Sherman, L., J. Schmidt and R. Velke (1992). High Crime Taverns: A RECAP Project in Problem-Oriented Policing. Washington, D.C.: Crime Control Institute.
Smith, D., M. Gregson and J. Morgan (2003). Between the Lines: An Evaluation of the Secured Park Award Scheme. Home Office Research Study, No. 266. London: Home Office Research, Development and Statistics Directorate. [Full text]
Stedman, J. (2005). “Alcohol Issues in City Parks.” Unpublished presentation to the Chula Vista City Council. Chula Vista, CA: Chula Vista Police Department (November).
Weisel, D. (2005) Analyzing Repeat Victimization. Problem-Oriented Guides for Police, Problem Solving Tools Series No. 4. Washington, D.C.: U. S. Department of Justice, Office of Community Oriented Policing Services. [Full text]
Zanin, N., J. Shane and R.V. Clarke (2004). “Reducing Drug Dealing in Private Apartment Complexes In Newark, New Jersey.” A final report to the U.S. Department of Justice, Office of Community Oriented Policing Services, on the field applications of the Problem-Oriented Guides for Police project. Washington, D.C.: Office of Community Oriented Policing Services, U.S. Department of Justice. [Full Text]
You may order free bound copies in any of three ways:
Online: Department of Justice COPS Response Center
Email: askCopsRC@usdoj.gov
Phone: 800-421-6770 or 202-307-1480
Allow several days for delivery.
Send an e-mail with a link to this guide.
* required
Error sending email. Please review your enteries below.


